


Pass Microsoft Analyzing Data with Microsoft Power BI Exam in First Attempt Guaranteed Updated Dump from Test4Engine!
Pass DA-100 Exam with 142 Questions - Verified By Test4Engine
NEW QUESTION 31
You are creating a quick measure as shown in the following exhibit.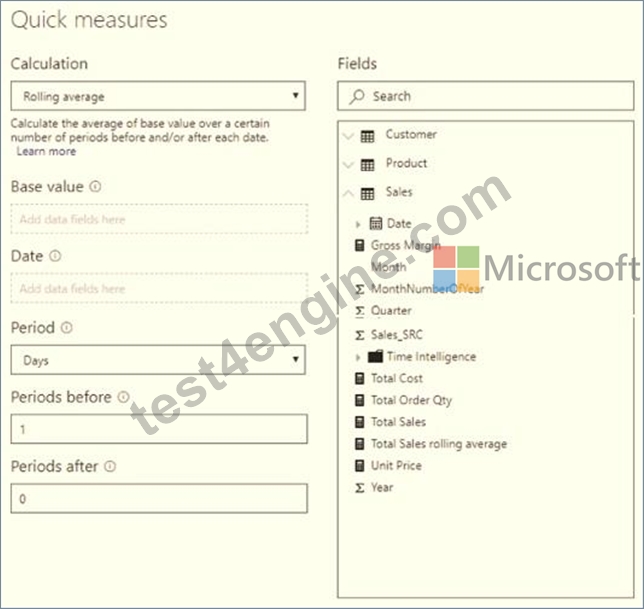
You need to create a monthly rolling average measure for Sales over time-How should you configure the quick measure calculation? To answer, select the appropriate options in the answer area.
NOTE: Each correct selection is worth one point.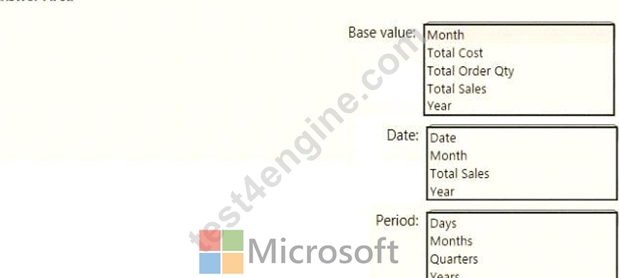
Answer:
Explanation: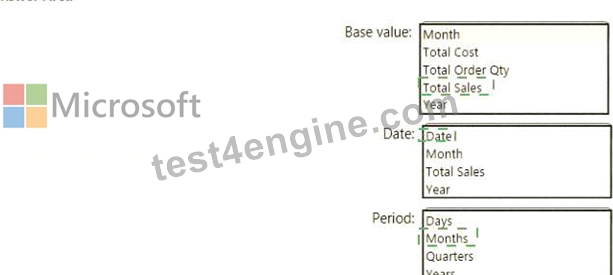
Explanation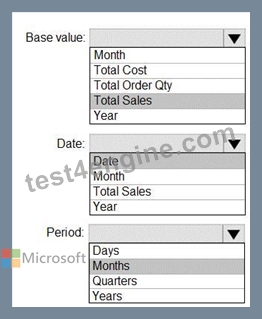
Box 1: Total Sales
We select the field Total Sales
Box 2: Date
Select a date field.
Box 3: Month
Monthly periods.
Reference:
https://docs.microsoft.com/en-us/power-bi/transform-model/desktop-quick-measures
NEW QUESTION 32
Case Study 1 - Litware, Inc.
Overview
Litware, Inc. is an online retailer that uses Microsoft Power Bl dashboards and reports. The company plans to leverage data from Microsoft SQL Server databases, Microsoft Excel files, text files, and several other data sources.
Litware uses Azure Active Directory (Azure AD) to authenticate users.
Existing Environment
Sales Data
Litware has online sales data that has the SQL schema shown in the following table.
In the Date table, the dateid column has a format of yyyymmdd and the month column has a format of yyyymm. The week column in the Date table and the weekid column in the Weekly_Returns table have a format of yyyyww. The regionid column can be managed by only one sales manager.
Data Concerns
You are concerned with the quality and completeness of the sales data. You plan to verify the sales data for negative sales amounts.
Reporting Requirements
Litware identifies the following technical requirements:
- Executives require a visual that shows sales by region.
- Regional managers require a visual to analyze weekly sales and
returns.
- Sales managers must be able to see the sales data of their respective region only.
- The sales managers require a visual to analyze sales performance
versus sales targets.
- The sale department requires reports that contain the number of sales transactions.
- Users must be able to see the month in reports as shown in the
following example: Feb 2020.
- The customer service department requires a visual that can be
filtered by both sales month and ship month independently.
You need to create a calculated column to display the month based on the reporting requirements.
Which DAX expression should you use?
- A. FORMAT('Date'[date],"MMM YYYY")
- B. FORMAT(,Date,[date_id],"WM YYYY")
- C. FORMAT(`Date'[date_id]-`'MM") & " " & FORMAT ('Date' [2021], "#")
- D. FORMAT('Date'[date],"M YY")
Answer: C
Explanation:
Scenario: In the Date table, the date_id column has a format of yyyymmdd. Users must be able to see the month in reports as shown in the following example: Feb 2020.
NEW QUESTION 33
You have an Azure SQL database that contains sales transactions. The database is updated frequently.
You need to generate reports from the data to detect fraudulent transactions. The data must be visible within five minutes of an update.
How should you configure the data connection?
- A. Set Data Connectivity mode to DirectQuery.
- B. Add a SQL statement.
- C. Set the Command timeout in minutes setting.
- D. Set Data Connectivity mode to Import.
Answer: A
Explanation:
With Power BI Desktop, when you connect to your data source, it's always possible to import a copy of the data into the Power BI Desktop. For some data sources, an alternative approach is available: connect directly to the data source using DirectQuery.
DirectQuery: No data is imported or copied into Power BI Desktop. For relational sources, the selected tables and columns appear in the Fields list. For multi-dimensional sources like SAP Business Warehouse, the dimensions and measures of the selected cube appear in the Fields list. As you create or interact with a visualization, Power BI Desktop queries the underlying data source, so you're always viewing current data.
Reference:
https://docs.microsoft.com/en-us/power-bi/connect-data/desktop-use-directquery
NEW QUESTION 34
You need to create relationships to meet the reporting requirements of the customer service department.
What should you create?
- A. an additional date table named ShipDate, a many-to-many relationship from Sales[sales_date_id] to Date[date_id], and a many-to-many relationship from Sales[sales_ship_date_id] to ShipDate[date_id]
- B. a one-to-many relationship from Date[date_id] to Sales[sales_date_id] and another one-to-many relationship from Date[date_id] to Sales[sales_ship_date_id]
- C. a one-to-many relationship from Date[date_id] to Sales[sales_date_id] and another one-to-many relationship from Date[date_id] to Weekly_Returns[week_id]
- D. an additional date table named ShipDate, a one-to-many relationship from Sales[sales_date_id] to Date[date_id], and a one-to-many relationship from Sales[sales_ship_date_id] to ShipDate[date_id]
- E. a one-to-many relationship from Sales[sales_date_id] to Date[date_id] and a one-to-many relationship from Sales[sales_ship_date_id] to Date[date_id]
Answer: B
Explanation:
Explanation
Scenario: The customer service department requires a visual that can be filtered by both sales month and ship month independently.
Reference:
https://docs.microsoft.com/en-us/power-bi/transform-model/desktop-relationships-understand
NEW QUESTION 35
You need to create relationships to meet the reporting requirements of the customer service department.
What should you create?
- A. an additional date table named ShipDate, a many-to-many relationship from Sales[sales_date_id] to Date[date_id], and a many-to-many relationship from Sales[sales_ship_date_id] to ShipDate[date_id]
- B. a one-to-many relationship from Date[date_id] to Sales[sales_date_id] and another one-to-many relationship from Date[date_id] to Weekly_Returns[week_id]
- C. a one-to-many relationship from Sales[sales_date_id] to Date[date_id] and a one-to-many relationship from Sales[sales_ship_date_id] to Date[date_id]
- D. a one-to-many relationship from Date[date_id] to Sales[sales_date_id] and another one-to-many relationship from Date[date_id] to Sales[sales_ship_date_id]
- E. an additional date table named ShipDate, a one-to-many relationship from Sales[sales_date_id] to Date[date_id], and a one-to-many relationship from Sales[sales_ship_date_id] to ShipDate[date_id]
Answer: E
Explanation:
Scenario: The customer service department requires a visual that can be filtered by both sales month and ship month independently.
Reference:
https://docs.microsoft.com/en-us/power-bi/transform-model/desktop-relationships-understand Overview This is a case study. Case studies are not timed separately. You can use as much exam time as you would like to complete each case. However, there may be additional case studies and sections on this exam. You must manage your time to ensure that you are able to complete all questions included on this exam in the time provided.
To answer the questions included in a case study, you will need to reference information that is provided in the case study. Case studies might contain exhibits and other resources that provide more information about the scenario that is described in the case study. Each question is independent of the other questions in this case study.
At the end of this case study, a review screen will appear. This screen allows you to review your answers and to make changes before you move to the next section of the exam. After you begin a new section, you cannot return to this section.
To start the case study
To display the first question in this case study, click the Next button. Use the buttons in the left pane to explore the content of the case study before you answer the questions. Clicking these buttons displays information such as business requirements, existing environment and problem statements. If the case study has an All Information tab, note that the information displayed is identical to the information displayed on the subsequent tabs. When you are ready to answer a question, click the Question button to return to the question.
NEW QUESTION 36
You need to create a measure that will return the percentage of late orders.
How should you complete the DAX expression? To answer, select the appropriate options in the answer area.
NOTE: Each correct selection is worth one point.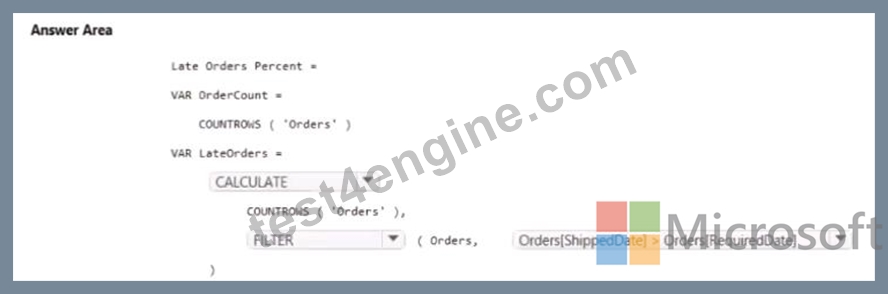
Answer:
Explanation:
NEW QUESTION 37
You have a dataset named Pens that contains the following columns:
Unit Price
Quantity Ordered
You need to create a visualization that shows the relationship between Unit Price and Quantity Ordered. The solution must highlight orders that have a similar unit price and ordered quantity.
Which type of visualization and which feature should you use? To answer, select the appropriate options in the answer area.
NOTE: Each correct selection is worth one point.
Answer:
Explanation:
Explanation:
Box 1: A scatter plot...
A scatter chart always has two value axes to show: one set of numerical data along a horizontal axis and another set of numerical values along a vertical axis. The chart displays points at the intersection of an x and y numerical value, combining these values into single data points. Power BI may distribute these data points evenly or unevenly across the horizontal axis. It depends on the data the chart represents.
Box 2: Automatically find clusters
Scatter charts are a great choice to show patterns in large sets of data, for example by showing linear or non-linear trends, clusters, and outliers.
Reference:
https://docs.microsoft.com/en-us/power-bi/visuals/power-bi-visualization-scatter
NEW QUESTION 38
Once the profit and loss dataset is created, which four actions should you perform in sequence to ensure that the business unit analysts see the appropriate profit and loss data? To answer, move the appropriate actions from the list of actions to the answer area and arrange them in the correct order.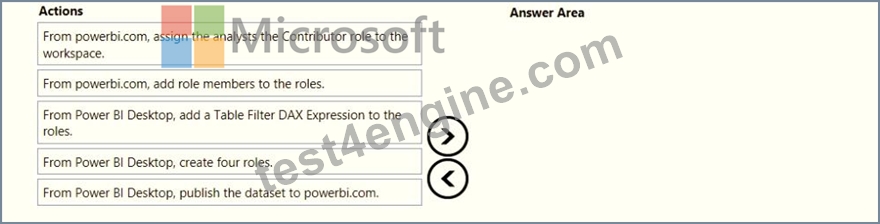
Answer:
Explanation:
1 - From powerbi.com, assign the analysts the Contributor role to the workspace.
2 - From poer BI Dextop, add a Table Filter DAX Expression to the roles.
3 - From powerbi.com, add role members to the roles.
NEW QUESTION 39
You have a table that contains the following three columns:
* City
* Total Sales
* Occupation
You need to create a key influencers visualization as shown in the exhibit. (Click the Exhibit tab.)
How should you configure the visualization? To answer, select the appropriate options in the answer area.
NOTE: Each correct selection is worth one point.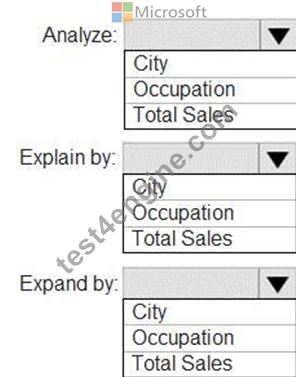
Answer:
Explanation:
Explanation
Box 1: Total Sales
Box 2: Occupation
Box 3: City
You can use Expand By to add fields you want to use for setting the level of the analysis without looking for new influencers.
Reference:
https://docs.microsoft.com/en-us/power-bi/visuals/power-bi-visualization-influencers
NEW QUESTION 40
You build a report about warehouse inventory data. The dataset has more than 10 million product records from 200 warehouses worldwide. You have a table named Products that contains the columns shown in the following table.
Warehouse managers report that it is difficult to use the report because the report uses only the product name in tables and visuals. The product name is contained within the ProductDescription column and is always the fourth value.
You need to modify the report to support the warehouse managers requirement to explore inventory levels at different levels of the product hierarchy. The solution must minimize the model size.
Which three actions should you perform in sequence? To answer, move the appropriate actions from the list of actions to the answer area and arrange them in the correct order.
Answer:
Explanation: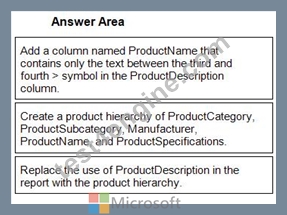
1 - Add a column named ProductName that contains only the text between the third and fourth > symbol in the ProductDescription column.
2 - Create a product hierarchy of ProductCategory, ProductSubcategory, Manufacturer, ProductName, and ProductSpecifications.
3 - Replace the use of ProductDescription in the report with the product hierarchy.
Explanation: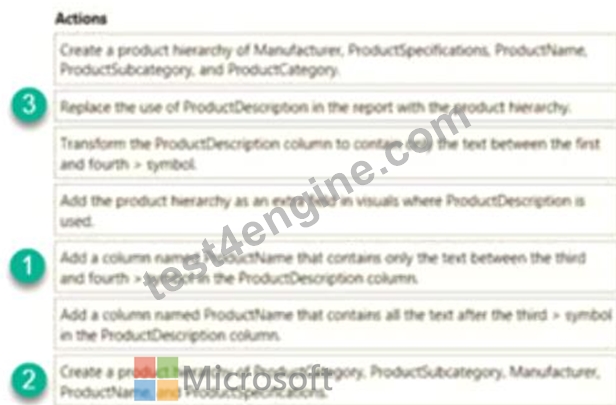
NEW QUESTION 41
You have a prospective customer list that contains 1,500 rows of data. The list contains the following fields:
* First name
* Last name
* Email address
* State/Region
* Phone number
You import the list into Power Query Editor.
You need to ensure that the list contains records for each State/Region to which you want to target a marketing campaign.
Which two actions should you perform? Each correct answer presents part of the solution.
NOTE: Each correct selection is worth one point.
- A. Open the Advanced Editor.
- B. Select Column profile.
- C. Enable Column profiling based on entire dataset
- D. Select Column quality.
- E. Select Column distribution
Answer: B,C
Explanation:
Explanation
In Power query, the load preview by default is 1000 row. By default, the column quality also only looks at the first 1000 row. You can verify this by the status bar at the bottom of the Power query window. To change the profiling so it analyses the entire column of data, select the profiling status in the status bar. Then select Column profiling based on the entire data set.
https://theexcelclub.com/data-profiling-views-in-power-query-excel-and-power-bi/
NEW QUESTION 42
You have the tables shown in the following table.
The Impressions table contains approximately 30 million records per month.
You need to create an ad analytics system to meet the following requirements:
* Present ad impression counts for the day, campaign, and Site_name. The analytics for the last year are required.
* Minimize the data model size.
Which two actions should you perform? Each correct answer presents part of the solution.
NOTE: Each correct selection is worth one point.
- A. Create a calculated table that contains Ad_id, Site_name, and Impression_date.
- B. Create one-to-many relationships between the tables.
- C. Group the impressions by Ad_id, Site_name, and Impression_date.
Aggregate by using the CountRows function. - D. Create a calculated measure that aggregates by using the COUNTROWS function.
Answer: B,C
NEW QUESTION 43
You have four sales regions. Each region has multiple sales managers.
You implement row-level security (RLS) in a data model. You assign the relevant distribution lists to each role.
You have sales reports that enable analysis by region. The sales managers can view the sales records of their region. The sales managers are prevented from viewing records from other regions.
A sales manager changes to a different region.
You need to ensure that the sales manager can see the correct sales data.
What should you do?
- A. Request that the sales manager be added to the correct Azure Active Directory group.
- B. From Microsoft Power Bl Desktop, edit the Row-Level Security setting for the reports.
- C. Manage the permissions of the underlying dataset
- D. Change the Microsoft Power Bl license type of the sales manager.
Answer: A
Explanation:
Explanation
Using AD Security Groups, you no longer need to maintain a long list of users.
All that you will need to do is to put in the AD Security group with the required permissions and Power BI will do the REST! This means a small and simple security file with the permissions and AD Security group.
Note: Configure role mappings
Once published to Power BI, you must map members to dataset roles.
Members can be user accounts or security groups. Whenever possible, we recommend you map security groups to dataset roles. It involves managing security group memberships in Azure Active Directory. Possibly, it delegates the task to your network administrators.
Reference:
https://www.fourmoo.com/2018/02/20/dynamic-row-level-security-is-easy-with-active-directory-security-groups
https://docs.microsoft.com/en-us/power-bi/guidance/rls-guidance
NEW QUESTION 44
You build a report about warehouse inventory data. The dataset has more than 10 million product records from
200 warehouses worldwide. You have a table named Products that contains the columns shown in the following table.
Warehouse managers report that it is difficult to use the report because the report uses only the product name in tables and visuals. The product name is contained within the ProductDescription column and is always the fourth value.
You need to modify the report to support the warehouse managers requirement to explore inventory levels at different levels of the product hierarchy. The solution must minimize the model size.
Which three actions should you perform in sequence? To answer, move the appropriate actions from the list of actions to the answer area and arrange them in the correct order.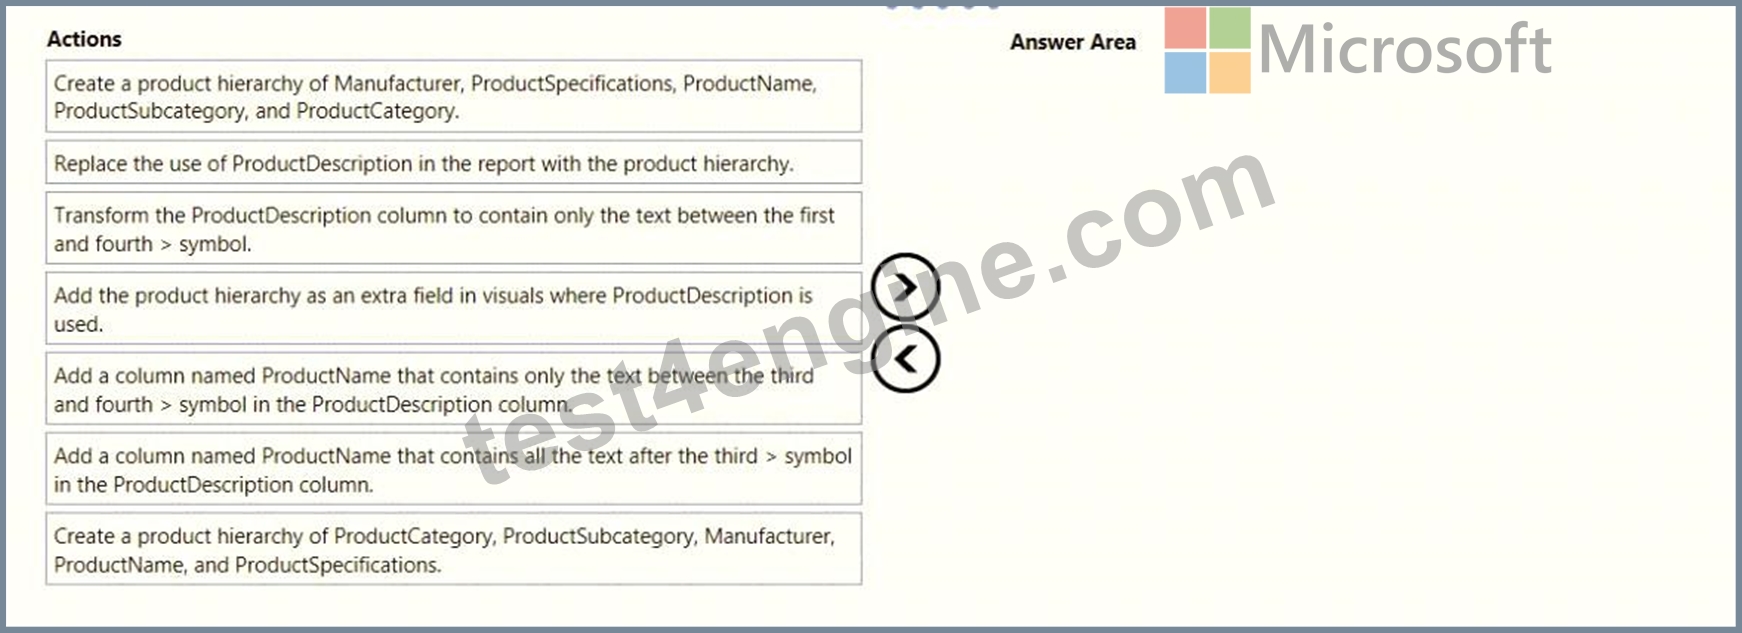
Answer:
Explanation:
Explanation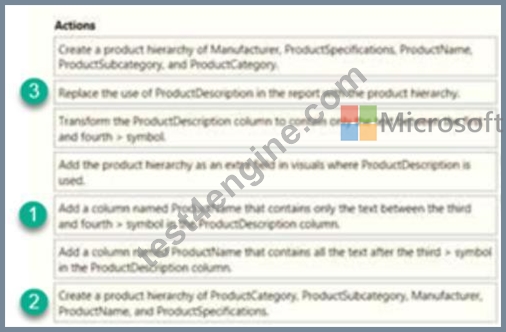
NEW QUESTION 45
You are creating a Microsoft Power BI data model that has the tables shown in the following table.
The Products table is related to the ProductCategory table through the ProductCategoryID column.
You need to ensure that you can analyze sales by product category.
How should you configure the relationships from Products to ProductCategory? To answer, select the appropriate options in the answer area.
NOTE: Each correct selection is worth one point.
Answer:
Explanation: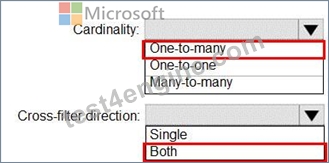
Reference:
https://docs.microsoft.com/en-us/power-bi/transform-model/desktop-relationships-understand
NEW QUESTION 46
You have a query that returns the data shown in the following exhibit.
You need to configure the query to display the data as shown in the following exhibit.
Which step should you use in the query?
- A. = Table.Unpivot(Source, {"classes"}, "Attribute", "Value")
- B. = Table.SplitColumn(Source, "classes". Splitter.SplitTextByDelimiterf",", QuoteStyle.None),
{"classes.1"}) - C. = Table.SplitColumn(Source, "classes". Splitter.SplitTextByPositions({10}), {"classes.1"})
- D. =Table.ExpandListColum(Table.TransformColunins(Source, {{"classes".
Splitter.SplitTextByDelimiter('','', QuoteStyle.None), let itemType - (type nullable text) meta
[Serialized.Text = true] in type {itemType}}}), "classes")
Answer: C
NEW QUESTION 47
You have two tables named Customers and Invoice in a Power BI model. The Customers table contains the following fields:
CustomerID
Customer City
Customer State
Customer Name
Customer Address 1
Customer Address 2
Customer Postal Code
The Invoice table contains the following fields:
Order ID
Invoice ID
Invoice Date
Customer ID
Total Amount
Total Item Count
The Customers table is related to the Invoice table through the Customer ID columns. A customer can have many invoices within one month.
The Power BI model must provide the following information:
The number of customers invoiced in each state last month
The average invoice amount per customer in each postal code
You need to define the relationship from the Customers table to the Invoice table. The solution must optimize query performance.
What should you configure? To answer, select the appropriate options in the answer area.
NOTE: Each correct selection is worth one point.
Answer:
Explanation: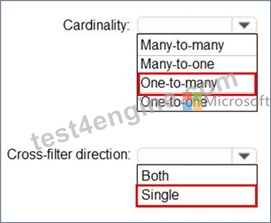
Reference:
https://docs.microsoft.com/en-us/power-bi/transform-model/desktop-relationships-understand
NEW QUESTION 48
......
Penetration testers simulate DA-100 exam: https://www.test4engine.com/DA-100_exam-latest-braindumps.html
Free Test Engine For Analyzing Data with Microsoft Power BI Certification Exams: https://drive.google.com/open?id=1JINrB_XakESI62_Uuir_GymClbNAnT5y