


The New SPI 2024 Updated Verified Study Guides & Best Courses
Authentic SPI Exam Dumps PDF - 2024 Updated
ARDMS SPI Exam Syllabus Topics:
| Topic | Details |
|---|---|
| Topic 1 |
|
| Topic 2 |
|
| Topic 3 |
|
| Topic 4 |
|
| Topic 5 |
|
NEW QUESTION # 23
Which resolution can be evaluated in the area indicated by the red oval in this image of a tissue-equivalent phantom?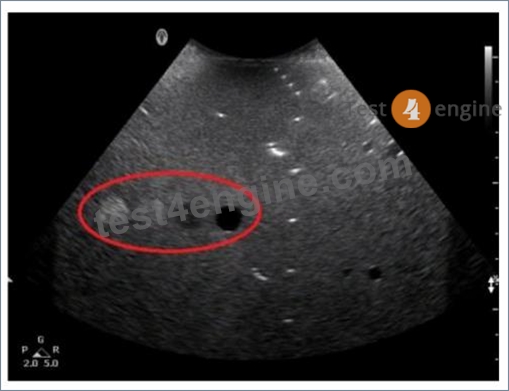
- A. Axial
- B. Elevational
- C. Lateral
- D. Contrast
Answer: A
Explanation:
The tissue-equivalent phantom image with the red oval indicates an area where axial resolution can be evaluated. Axial resolution refers to the ability to distinguish between two structures that are close together along the axis of the ultrasound beam. It is determined by the spatial pulse length (SPL) of the ultrasound wave. In phantoms, this is typically tested by observing the ability to separate closely spaced targets along the beam's path.
Reference:
ARDMS Sonography Principles & Instrumentation Guidelines
Hedrick WR, Hykes DL, Starchman DE. Ultrasound Physics and Instrumentation. 4th ed. Philadelphia, PA: Elsevier Saunders; 2005.
NEW QUESTION # 24
Which artifact is seen as a result of an increase in echo amplitude in the tissue located distal to an anechoic structure?
- A. Reverberation
- B. Enhancement
- C. Comet tail
- D. Mirror image
Answer: B
NEW QUESTION # 25
Which control determines the amount of amplification occurring in the receiver?
- A. Persistence
- B. Overall gain
- C. Dynamic range
- D. Output power
Answer: B
Explanation:
Overall gain controls the amplification of all the received ultrasound signals uniformly. This adjustment affects the brightness of the entire image by increasing or decreasing the amplification of the echoes returning from all depths. It is a primary control for adjusting image brightness. The overall gain should be set to an appropriate level to ensure that the ultrasound image is neither too bright (over-gained) nor too dark (under-gained), allowing for optimal visualization of the anatomical structures.
Reference:
American Registry for Diagnostic Medical Sonography (ARDMS). Sonography Principles and Instrumentation (SPI) Examination Review Guide.
NEW QUESTION # 26
Which color control was adjusted in color bar A to produce color bar B?
- A. Map
- B. Baseline
- C. Invert
- D. Scale
Answer: D
Explanation:
The color bar on a Doppler ultrasound display indicates the range of velocities that the system can detect and display. In color bar A, the scale is set to a higher maximum velocity (64 cm/s), while in color bar B, the scale is set to a lower maximum velocity (16 cm/s). Adjusting the scale (or velocity range) changes the upper and lower limits of the velocities displayed, which affects the sensitivity of the Doppler system to detect flow velocities. Lowering the scale allows for better visualization of lower velocities, but it may also increase the likelihood of aliasing for higher velocities.
Reference:
American Registry for Diagnostic Medical Sonography (ARDMS). Sonography Principles and Instrumentation (SPI) Examination Review Guide.
NEW QUESTION # 27
Which transducer was most likely used to create this image?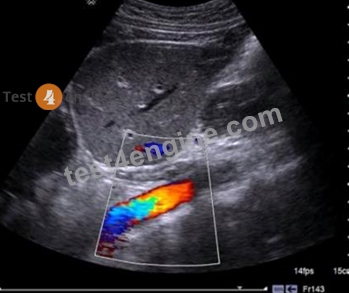
- A. Endocavity
- B. Phased array
- C. Curvilinear
- D. Linear array
Answer: C
Explanation:
The image shown is typical of an abdominal ultrasound, which commonly utilizes a curvilinear transducer. Curvilinear transducers have a wider field of view at depth, making them ideal for imaging large structures within the abdomen. These transducers emit a curved beam, allowing for better penetration and a broader field of view, which is necessary for comprehensive abdominal examinations. The curvature of the image, the wide field of view, and the depth of penetration all suggest the use of a curvilinear transducer.
Reference:
American Registry for Diagnostic Medical Sonography (ARDMS). Sonography Principles and Instrumentation (SPI) Examination Review Guide.
NEW QUESTION # 28
What is the relationship between overall gain and image brightness?
- A. The higher the overall gain, the brighter the image
- B. The higher the overall gain, the darker the image
- C. There is no relationship between overall gain and image brightness
- D. The lower the overall gain, the brighter the image
Answer: A
Explanation:
Overall gain in ultrasound refers to the amplification of all the received echo signals. Increasing the overall gain amplifies the signals, making the entire image brighter. Conversely, decreasing the overall gain reduces the signal amplification, resulting in a darker image. Overall gain adjustment affects the entire image uniformly, unlike time gain compensation (TGC), which adjusts the gain at different depths independently.
Reference:
ARDMS Sonography Principles and Instrumentation (SPI) Exam Study Guide
"Diagnostic Ultrasound: Principles and Instruments" by Frederick W. Kremkau
NEW QUESTION # 29
Which adjustment would reduce the noise in the Doppler waveform in this image?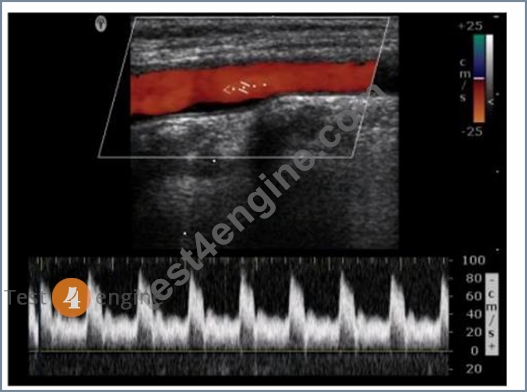
- A. Decreasing velocity scale
- B. Increasing sweep speed
- C. Increasing the gate size
- D. Decreasing Doppler gain
Answer: D
Explanation:
Noise in the Doppler waveform can often be attributed to excessive gain settings. Decreasing the Doppler gain reduces the amplification of both the signal and the noise, thus providing a clearer and more accurate Doppler waveform. Excessive gain can cause speckling and clutter, which obscure the true Doppler signals. By reducing the gain, the noise level is minimized, resulting in a cleaner Doppler signal representation.
Reference:
ARDMS Sonography Principles & Instrumentation Guidelines
Hagen-Ansert SL. Textbook of Diagnostic Ultrasonography. 8th ed. St. Louis, MO: Mosby; 2017.
NEW QUESTION # 30
What is the primary determining factor of the fundamental frequency for pulsed wave transducers?
- A. Crystal diameter
- B. Propagation speed
- C. Transducer type
- D. Element thickness
Answer: D
Explanation:
The fundamental frequency of a pulsed wave transducer is primarily determined by the thickness of the piezoelectric element. The frequency is inversely proportional to the thickness of the element - thinner elements produce higher frequencies, while thicker elements produce lower frequencies. This relationship is derived from the formula =2f=2dv,where f is the frequency, v is the propagation speed of sound in the piezoelectric material, and d is the thickness of the element.
Reference: ARDMS Sonography Principles and Instrumentation, Chapter on Transducer Technology.
NEW QUESTION # 31
What is the function of M-mode?
- A. Monitor blood flow
- B. Measure movement
- C. Create 3D images
- D. Visualize internal organs
Answer: B
Explanation:
M-mode (Motion mode) is used in ultrasound to measure and display the movement of structures over time.
This mode is particularly useful in cardiac imaging to assess the motion of heart walls and valves.
M-mode provides a one-dimensional view of the motion of tissues and is often used in conjunction with 2D imaging for a comprehensive assessment.
It is essential in evaluating the dynamic function of organs, especially in cardiology, where precise measurements of cardiac structures' movement are crucial. Reference:
ARDMS Sonography Principles and Instrumentation guidelines on modes of ultrasound imaging and their clinical applications.
NEW QUESTION # 32
Which index is related to the likelihood of cavitation?
- A. Temporal
- B. Thermal
- C. Acoustical output
- D. Mechanical
Answer: D
Explanation:
The Mechanical Index (MI) is related to the likelihood of cavitation, which is the formation of gas bubbles in a liquid due to the low-pressure regions of the ultrasound wave. MI is a parameter that predicts the potential for mechanical bioeffects, including cavitation. A higher MI indicates a greater likelihood of cavitation occurring. It is calculated based on the peak negative pressure and the frequency of the ultrasound wave.
Reference:
ARDMS Sonography Principles and Instrumentation guidelines
Kremkau, F. W. (2015). Diagnostic Ultrasound: Principles and Instruments.
NEW QUESTION # 33
Which factor influences color flow imaging frame rate?
- A. Line density
- B. Variance map selection
- C. Filter selection
- D. Dynamic range
Answer: A
Explanation:
The frame rate in color flow imaging is influenced by several factors, one of the most significant being line density. Line density refers to the number of ultrasound lines used to create an image. Increasing line density improves spatial resolution but requires more time to acquire each frame, thereby reducing the frame rate. Other factors such as filter selection, dynamic range, and variance map selection can affect the quality of the color flow image, but they do not have as direct an impact on frame rate as line density does.
Reference: ARDMS Sonography Principles and Instrumentation, Chapter on Color Doppler Imaging.
NEW QUESTION # 34
During 3-D volume acquisition, the quality of the images is most dependent upon which factor?
- A. Rendering method utilized
- B. Number of slices acquired
- C. Power output
- D. Speed of post-processing image compression
Answer: B
Explanation:
During 3-D volume acquisition in ultrasound, the quality of the images is most dependent on the number of slices acquired. This is because the more slices (or planes) that are captured, the more detailed and accurate the reconstruction of the 3-D volume will be. This allows for better spatial resolution and more precise visualization of anatomical structures. Other factors, such as power output, rendering methods, and speed of post-processing, also affect image quality but are secondary to the number of slices in terms of fundamental image acquisition quality.
Reference: ARDMS Sonography Principles and Instrumentation (SPI) Review, 3-D Ultrasound Imaging section.
NEW QUESTION # 35
How is intensity of an ultrasound beam measured?
- A. Autocorrelation
- B. Doppler equation
- C. Hydrophone
- D. Reynold's number
Answer: C
Explanation:
The intensity of an ultrasound beam is measured using a hydrophone. A hydrophone is a specialized device that detects and measures the acoustic pressure of the ultrasound waves in water or tissue-mimicking materials. It is highly sensitive and can measure the variations in pressure, which are used to calculate the intensity and other acoustic parameters of the ultrasound beam.
Reference:
ARDMS Sonography Principles and Instrumentation guidelines
Hoskins, P. R., Thrush, A., Martin, K., & Whittingham, T. A. (2010). Diagnostic Ultrasound: Physics and Equipment.
NEW QUESTION # 36
Which action would increase the frame rate?
- A. Decreasing the logarithmic compression
- B. Decreasing the number of focal zones
- C. Increasing the number of lines per frame
- D. Increasing the sector width
Answer: B
Explanation:
The frame rate in ultrasound imaging is influenced by several factors, including the number of focal zones. Each focal zone requires additional transmission and reception cycles, thus decreasing the frame rate. By decreasing the number of focal zones, the system requires fewer cycles per frame, which increases the frame rate. This enhances the temporal resolution, making it easier to capture fast-moving structures in real-time imaging.
Reference:
ARDMS Sonography Principles & Instrumentation Guidelines
Hagen-Ansert SL. Textbook of Diagnostic Ultrasonography. 8th ed. St. Louis, MO: Mosby; 2017.
NEW QUESTION # 37
What happens to the Doppler shift when the angle is changed from 30 to 60 degrees?
- A. Loss of Doppler signal
- B. Increases
- C. Decreases
- D. No significant change
Answer: C
Explanation:
The Doppler shift is directly related to the cosine of the angle between the ultrasound beam and the direction of blood flow. As the angle increases from 30 degrees to 60 degrees, the cosine of the angle decreases (cosine of 30 degrees is approximately 0.87, while cosine of 60 degrees is 0.5). Since the Doppler shift is proportional to the cosine of the angle, increasing the angle results in a decreased Doppler shift. This means the measured blood flow velocities will appear lower at a 60-degree angle compared to a 30-degree angle.
Reference:
American Registry for Diagnostic Medical Sonography (ARDMS). Sonography Principles and Instrumentation (SPI) Examination Review Guide.
NEW QUESTION # 38
What does this image demonstrate?
- A. Presence of flow
- B. Direction of flow
- C. Color aliasing
- D. Color inversion
Answer: C
Explanation:
Color aliasing in Doppler ultrasound occurs when the velocity of blood flow exceeds the Nyquist limit, causing the color display to wrap around and display high velocities incorrectly as the opposite direction. This phenomenon is characterized by a mix of colors that indicate flow in both directions at the same location. In the provided image, there is a clear presence of color aliasing, as evidenced by the abrupt color change across the vessel, which is not consistent with normal flow patterns.
Reference:
American Registry for Diagnostic Medical Sonography (ARDMS) Sonography Principles and Instrumentation guidelines.
NEW QUESTION # 39
......
Get Prepared for Your SPI Exam With Actual 110 Questions: https://www.test4engine.com/SPI_exam-latest-braindumps.html
Valid SPI Test Answers Full-length Practice Certification Exams: https://drive.google.com/open?id=1O4bnObKTbVHMJ8TAR3dQGIRut_GT4Y0a